New Survey Reveals Statewide Opinions on COVID-19 Economic Impact, Business Priorities, Vaccine, and Government Action
December 15, 2020“As we mark the ninth month of the pandemic, promising news on vaccine distribution, and the Governor temporarily reimposing business restrictions, the Chamber wanted to assess how voters feel about Michigan’s health, economy, and political situation,” said Sandy K. Baruah, president and CEO of the Detroit Regional Chamber. “Similar to our statewide polls in April and May, voters are sending a clear message that public health measures are essential to beating the pandemic and that the public health crisis and business restrictions are harming our economy.”
“This poll also highlighted a series of new concerns for Michigan voters,” said Baruah. “Voters were clear that government leaders need to support small businesses, keep manufacturing open, and do more to find a bipartisan consensus to stop the pandemic.”
The poll results show remarkable stability in how seriously Michiganders are taking the virus and how concerned they remain about the economic consequences of prolonged shutdowns.
“There is a lot of nuance in how voters are approaching this crisis,” said Richard Czuba, president of Glengariff Group Inc. “As we’ve seen in the past, voters understand the health risk of the pandemic. But these numbers also show that voters understand the economic difficulties facing small businesses. Voters are saying they understand the health dimension, but they also are saying we want to make sure small businesses are helped through the economic crisis. Voters are saying both are important.”
The following are some key themes from the polling results:
Michiganders Continue to View COVID-19 as a Public Health Threat
- A majority of Michigan voters believe the pandemic situation is worse in Michigan than in April. 82.7% of Michigan residents believe the situation is the same or worse than April.
- 60.3% believe the threat of COVID-19 has been balanced or downplayed, compared to 33.8% who believe the threat has been exaggerated. Those numbers remain virtually unchanged from May when 58.8% believed the threat of COVID-19 has been balanced or downplayed, compared to 32.2% who believed the threat has been exaggerated.
- 83.8% of Michigan voters say that getting the pandemic under control would help Michigan’s economy.
Michigan Voters Overwhelmingly Say the Economy is Worse Than Before Pandemic
- 83.7% of Michigan voters believe the state’s economy is worse now than before the pandemic hit.
- There is deep and broad agreement among every demographic group that Michigan’s economy is worse since the pandemic.
- 58 of Michigan voters say that COVID-19 is affecting their household finances.
- Voters described COVID-19’s impact on their household finances. The numbers on the left look at December 2020 compared to the numbers on the right from May 2020. One in four voters continues to deal with catastrophic or major effects on their household finances.
| Dec. | May | Effect | |
| 6.2% | 5.0% | Catastrophic | |
| 18.0% | 18.8% | Major effect | |
| 34.2% | 46.3% | Minor effect | |
| 41.0% | 27.7% | No effect |
- The most significant impact continues to be on voters under the age of 40 years old. For voters 18-29, 34.1% said the impact was catastrophic or major. For voters 30-39, 32.8% said the impact was catastrophic or major.
- 45.8% said the economy was worse because elected officials kept shutting down businesses.
- 39.6% said the economy was worse because we cannot get the virus under control.
Top Post-Pandemic Priority: Support Small Businesses
- 58% of Michigan voters said helping small businesses bounce back was the first issue that state leaders should address.
- Voters shared what they believe is the first issue state leaders should work on once Michigan emerges from the pandemic.
- 58.0% – Helping small businesses bounce back.
- 6.7% – Improving access to health care.
- 6.3% – Job training for people hurt by the pandemic.
- 6.2% – Attracting more jobs to the state.
- 5.8% – Improving Michigan’s schools.
- 2.3% – Fixing Michigan’s roads and bridges.
- 2.2% – Lowering the cost of college tuition.
- 5.2% – Miscellaneous issues.
“We are gratified that by a wide margin, Michigan voters agree with the Chamber that supporting small businesses is their top priority,” said Baruah.
Last week in a letter to the Michigan Congressional Delegation, the Chamber urged swift passage of a bipartisan pandemic relief bill that takes on the following measures:
- Paycheck Protection Program
- Enhanced Unemployment Assistance
- Assistance to States
- Legal Liability Protection for Businesses
“The Chamber recognizes that businesses are struggling through no fault of their own. A robust post-pandemic recovery requires bipartisan action to provide relief,” said Baruah. “The time to act is now, and leaders at the state and local level should be working on solutions that help small businesses.”
Michigan Voters Put Priority on Keeping Business Open
Voters were given a list of five entities and asked if they could only keep ONE open, which would be their highest priority.
- 30.3% – Manufacturing plants
- 22.8% – Retail and small businesses
- 18.7% – K-12 schools
- 3.8% – Construction companies
- 3.5% – Restaurants
Cumulatively, business was the highest priority among all party affiliations. But at 24.1%, K-12 schools was the single highest priority for Strong Republican voters.
Governor Gets Higher Marks for Handling Pandemic Than Legislature
- 63.3% of Michigan voters believe Gov. Whitmer is aggressively working on getting the pandemic under control and protecting public health. These favorable numbers for the Governor are virtually the same as they were in May.
- 27.0% of voters believe she is not doing everything. More than half of the individuals who said the Governor was not doing everything said it was because she should open businesses or do nothing.
- One-third of Republican voters believe Gov. Whitmer is doing everything she can to get the pandemic under control. Republican opposition of out-state voters drives the differences by region.
- 29.0% of Michigan voters say the state’s legislative leaders are doing everything they can to get the pandemic under control. 46.5% of voters say they are not doing everything they can do.
- The 46.5% of voters that said legislative leaders were not doing everything they could do were asked what they should be doing:
- 40.9% said they should work and compromise with the Governor.
- 11.1% said they should listen to scientists and health officials.
- 8.6% said they should work on financial help.
- 8.2% said they should enforce restrictions like masks and social distancing.
Voters Don’t See Bipartisanship
- Voters rated Gov. Whitmer on a scale of one to 10 for working in a bipartisan manner to get the pandemic under control. Overall, voters rated Gov. Whitmer at 5.8.
- Metro voters rated her 6.5. Out-state voters rated her at 5.1. Independent voters rate her at 6.0 for bipartisanship.
| Party | Rating | |
| Strong Dem | 8.4 | |
| Lean Dem | 7.6 | |
| Independent | 6.0 | |
| Lean GOP | 4.1 | |
| Strong GOP | 2.9 |
- Voters rated the State Legislature leaders on a scale of one to 10 for working in a bipartisan manner to get the pandemic under control. Overall, voters rated legislative leadership at 4.5. Legislative leaders get their highest rating from Leaning Democratic and Independent voters.
| Party | Rating | |
| Strong Dem | 4.1 | |
| Lean Dem | 5.3 | |
| Independent | 4.9 | |
| Lean GOP | 4.6 | |
| Strong GOP | 4.2 |
Michiganders Wear Masks With Strong Support of an Indoor Mask Requirement
“The Chamber has been vocal from the start of the crisis that the universal use of masks in public is critical to keeping businesses open. This poll shows voters overwhelmingly agree through their actions and support for an indoor mask mandate,” said Baruah.
- 79.8% of voters said they always wear a mask indoors in public. 13.3% wear a mask most of the time, and 3.5% said occasionally.
- In May 2020, 80.7% of voters said they wore a mask when in public. It appears these numbers have remained statistically unchanged.
- By a margin of 68.2%-29.8%, Michigan voters overwhelmingly support the State Legislature passing a requirement that everyone must wear a mask indoors in public places.
- Only one demographic group opposed a mask requirement: Strong Republican voters.
| Party | Support | Oppose | |
| Strong Dem | 95.9% | 1.7% | |
| Lean Dem | 91.1% | 7.1% | |
| Independent | 72.3% | 26.3% | |
| Lean GOP | 50.0% | 48.1% | |
| Strong GOP | 33.5% | 63.9% |
- 85.3% of voters say wearing a mask in public is important. There is only one noticeable demographic group where these numbers drop – Strong Republican. Only 65.2% of Strong Republican voters believe it is important to wear a mask in public.
Michiganders Listen to Public Health Officials
- In addition to wearing masks, Michigan voters listen to public health officials, contributing to a noticeable decline in cases from the spike we had around Thanksgiving.
- 76.2% of Michigan voters have changed their holiday plans.
- 86% of Strong Democratic voters have changed their plans. 79% of Independent voters have changed their plans. 60% of Strong Republican voters have changed their plans.
- Voters reported specifically how their plans had changed:
- 19.9% – Smaller gatherings
- 19.9% – No travel plans
- 17.9% – No gatherings at all or staying alone
- 12.7% – Canceled plans
- 10.3% – Immediate family only
- 10.1% – No family get together
View the full findings from the December Michigan COVID Priorities Poll, the May and April public opinion poll, and the Chamber’s regional executive survey.
Additional Findings from the December MI COVID Priorities Poll:
Support Grows for Vaccinations
- 52.5% of Michigan voters now say they will get the vaccine when it is available. 30.0% say they will not get the vaccine. 13.2% of voters said it depends.
- This number represents a nearly eight-point increase from polling conducted in late October when only 44.6% said they would get the vaccine, 8% said they would not get the vaccine, and 17.5% said it depends.
- There are significant differences among the population of those who are willing to get the vaccine. The chart below compares those that will or will not get the vaccine based on party affiliation.
| Party Affiliation | Will | Will Not | |
| Strong Dem | 67.4% | 16.3% | |
| Lean Dem | 51.8% | 14.3% | |
| Independent | 50.8% | 28.5% | |
| Lean GOP | 51.9% | 31.5% | |
| Strong GOP | 41.1% | 47.5% |
- While 57.8% of white voters will get the vaccine, only 32.9% of Black voters will get the vaccine. 26.6% of Black voters said it depends. This reluctance reflects the mistrust caused by past governmental abuse related to vaccines and public health trials.
- The sharpest differences are by age, with voters over 50 willing to get the vaccine and those under 50 not planning to get the vaccine.
| Age | Will | Will Not | |
| 18-29 | 41.8% | 39.6% | |
| 30-39 | 36.1% | 46.2% | |
| 40-49 | 43.2% | 35.1% | |
| 50-64 | 63.5% | 22.4% | |
| 65+ | 70.8% | 11.7% |
“The Chamber is confident that support for the vaccine will continue to rise when it is successfully administered to frontline workers and those most at risk from the virus,” said Baruah. “We are committed to doing our part to promote an orderly and responsible vaccination program because that will help keep businesses open and put people back to work.”
Voters Split on How to Make School Work
- 49.7% of voters want to see schools held online, while 36.0% say it is safe to send children to school. 6.5% said school should be a combination of online and in person.
- These numbers are statistically identical to numbers from early September 2020.
| Time Period | Online | School/Safe | Combination |
| Sept. 2020 | 49.5% | 37.8% | 6.7% |
| Dec. 2020 | 49.7% | 36.0% | 6.5% |
- The division remains among parents with school-aged children on whether school should be online or in-person: 41.2% of parents said it was safe to send children to school, while 46.1% of parents said school should be online. 8.8% of parents said it should be a combination of the two.
Voters Comfortable with Grocery Stores, Work, and Socializing Outside
- On a scale of one to 10 voters shared how confident they were to attend specific locations. The higher the number, the greater the confidence in attending that location. The data below ranks the highest to the lowest levels of confidence.
- 7.8 – Grocery store
- 7.4 – Socialize with friends or family outdoors
- 7.3 – Work
- 5.9 – Church
- 5.7 – Socialize with friends or family indoors
- 5.4 – Eat indoors at a restaurant
- 4.5 – Gym or Health club
- 4.5 – Movies
- 4.0 – Bar
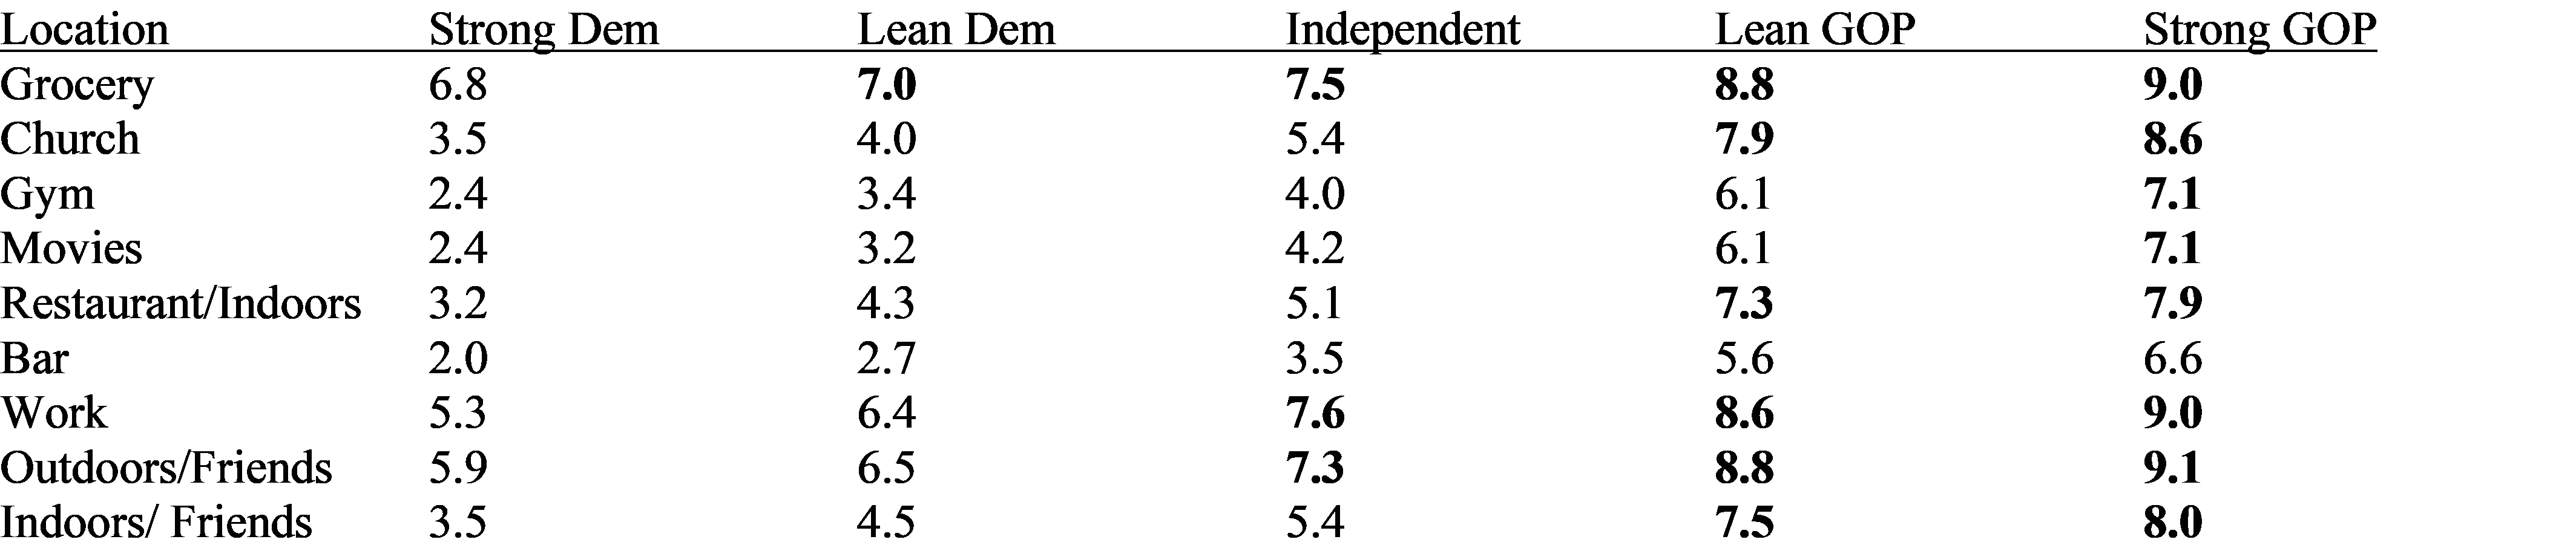
- The chart below rates all nine locations by party affiliation. All highlighted numbers are above 7.0.
- Strong GOP voters are confident above 7.0 going to every location, except bars.
- Independent voters are confident going to the grocery store, work, and outdoors with friends/family.
- Strong Democratic voters are not confident above 7.0 going to any of these locations.
Hand Washing Makes Everyone More Confident
Voters shared five different ways people could reduce the virus’s spread and asked how much confidence that action gave them on a scale of one to 10.
- 8.1 – To know people are regularly washing their hands.
- 7.3 – To see people remaining at least six feet apart.
- 7.1 – To see everyone wearing a mask in public.
- 6.9 – To know that people are avoiding gatherings of 10 or more people.
- 6.9 – To see people getting vaccinated.
-
-
Strong Democratic voters rated all five above 8.0. Independent voters rated all five above 7.0. Strong Republican voters rated only ‘washing hands’ above 7.0. Three of the five rated below 6.0 among Strong Republican voters.
###