Economic Indicators

data and research - michigan economic indicators web wide

To enhance the Detroit Regional Chamber’s robust Data and Research portfolio that includes the annual State of the Region, the State of Education and Talent, and Michigan is Automobility, the Chamber also provides timely updates on key economic metrics throughout the year with the Monthly Economic Indicator and quarterly Economic Indicator Update.

Together, these updates offer a holistic view of the Detroit Region’s challenges and successes in areas such as business growth, employment, innovation, and consumer trends, to help leaders make strategic decisions in a changing economic environment.


Expand for Monthly Economic Indicator Data

U.S. Real Gross Domestic Product

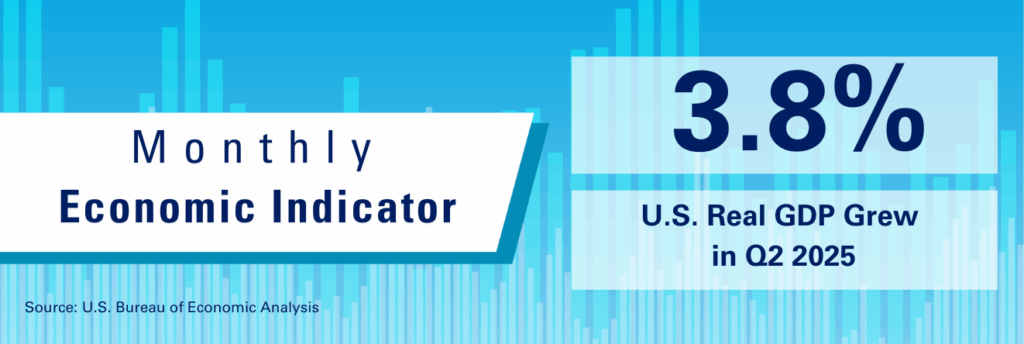
The U.S. Economy Grew in Q2 2025

Real gross domestic product (GDP) increased at an annual rate of 3.3 percent in the second quarter of 2025 (April, May, and June), according to the second estimate released by the U.S. Bureau of Economic Analysis. In the first quarter, real GDP decreased 0.5 percent. The increase in real GDP in the second quarter primarily reflected a decrease in imports, which are a subtraction in the calculation of GDP, and an increase in consumer spending. These movements were partly offset by decreases in investment and exports. Read the full BEA report.

The GDP is measured as the total market value of the goods and services produced within a specific geography during a given time period. Gross domestic product is a key indicator of the general health of the economy and its performance, with increases indicative of economic growth.

Chamber Perspective

Chamber Perspective Economic Indicators

U.S. Economy Grew in Second Quarter of 2025, But Progress is Complicated by Trade Policies

  • The U.S. economy grew by 3.3% in the second quarter of 2025, a shift from the previous quarter when GDP contracted at a rate of 0.5%. The GDP increase was reflected in a decrease in imports, which is a subtraction in GDP calculation, and an increase in consumer spending. In the first quarter of 2025, businesses tried to get ahead of the administration’s trade policies and increased imports, and in the second quarter, businesses have dialed back on imports, instead drawing from their existing inventories. This shift is impacting the overall GDP measure.

 Federal Reserve Cutting Rates

  • The Federal Reserve has announced its first rate cut of the year, reducing its benchmark interest rate by 0.25 percentage points to a target range of 4% to 4.25%. Despite this move, inflation continues to exceed the Fed’s 2% target, with the Consumer Price Index rising to 2.9% in August.

Regional Labor Market Conditions Remain Solid

  • Among other indicators, the unemployment rate remains low, and labor market conditions remain solid in the Detroit Region and the nation. The Detroit Region’s unemployment rate remained constant in July at 4.8%, 0.8 percentage points higher than the national rate (4.2%).

New Business Applications

increased 7% in Q2 2025.

New Business Applications

Consumer Sentiment

decreased to 55.4 in September 2025

Consumer Sentiment

Consumer Price Index

rose to an annual rate of 2.9% in August 2025

Consumer Price Index

Michigan and US Indicators

Monthly Unemployment Rate

Michigan’s Unemployment Rate Stays Constant in July 2025

Michigan’s July 2025 monthly unemployment rate was unchanged over the month, remaining at 5.3% during July, along with the Detroit Regions. The national unemployment rate increased by o.1 of a percentage point over the month to 4.2%. Michigan’s unemployment rate in June was 1.1 percentage points larger than the U.S. rate.


Total Employment

Employment Levels Up From the Previous Month in the Region 

Nonfarm employment in the Detroit Region reached 2,061,500 in July 2025, marking a 0.2% increase from the previous month. In contrast, overall employment across Michigan declined by 0.1% to 5,077,000, its lowest level since August 2024.

Job Postings

Job Postings Ramped Up in July 2025

In July 2025, total job postings in the Region reached 97,935—marking an 11% increase compared to the previous month. Registered nurses have emerged as the most in-demand occupation in 2025 so far, with over 15,000 postings recorded through July.


U.S. Real Gross Domestic Product

The U.S. Economy Grew in Q2 2025

Real gross domestic product (GDP) increased at an annual rate of 3.3 percent in the second quarter of 2025 (April, May, and June), according to the second estimate released by the U.S. Bureau of Economic Analysis. In the first quarter, real GDP decreased 0.5 percent. The increase in real GDP in the second quarter primarily reflected a decrease in imports, which are a subtraction in the calculation of GDP, and an increase in consumer spending. These movements were partly offset by decreases in investment and exports. Read the full BEA report.

The GDP is measured as the total market value of the goods and services produced within a specific geography during a given time period. Gross domestic product is a key indicator of the general health of the economy and its performance, with increases indicative of economic growth.

Consumer Price Index

Inflation Increased in August 2025

In August, the Consumer Price Index for All Urban Consumers rose 0.4 percent, seasonally adjusted, and rose 2.9 percent over the last 12 months, not seasonally adjusted. The index for all items less food and energy increased 0.3 percent in August (SA); up 3.1 percent over the year (NSA).  Read the full report.


Consumer Sentiment

Consumer Sentiment Worsens in September

The University of Michigan Surveys of Consumers, consumer sentiment registered at 55.4 in September 2025. According to Surveys of Consumers director, Joanne Hsu, consumer sentiment moved down less than three index points in early September. This month’s easing in economic views was particularly strong among lower and middle income consumers. Buying conditions for durables improved, while all other index components fell. Consumers continue to note multiple vulnerabilities in the economy, with rising risks to business conditions, labor markets, and inflation. Likewise, consumers perceive risks to their pocketbooks as well; current and expected personal finances both eased about 8% this month. Trade policy remains highly salient to consumers, with about 60% of consumers providing unprompted comments about tariffs during interviews, little changed from last month.  Read the full report. 

New Business Applications

Michigan’s New Business Applications Move Higher in Q2 2025

In the second quarter of 2025, seasonally adjusted new business applications rose by 7% from the previous quarter, reaching a total of 34,794. Although this marks a decline from the exceptional highs seen during the pandemic, application numbers continue to hold strong compared to pre-pandemic benchmarks.

U.S. Manufacturing PMI®

Economic Activity in the Manufacturing Sector Contracted in August for the Sixth Consecutive Month

The Manufacturing PMI® registered at 48.7% in August, a 0.7 percentage point higher compared to the 48.0 percent reported in July according to the Institute for Supply Management® (ISM®).  

ISM® states a reading above 50% shows that the manufacturing economy is generally expanding; below 50% indicates that it is generally contracting. The index is based on a monthly survey of supply chain managers and measures general direction of economic trends in manufacturing and other sectors.

Automotive Economic Indicators

Annual U.S. Light Vehicle Sales (SAAR)

New-Vehicle Sales Pace (SAAR) Maintain Strong Pace in August 

The new-vehicle sales pace in August was above 16 million for the second straight month and up from last year’s 15.1 million level. According to Cox Automotive, electric vehicle (EV) sales are expected to push new-vehicle sales higher in August as consumers take advantage of soon-to-expire federal tax credit.


Monthly U.S. Light Vehicle Sales

Vehicle Sales Increased in August 

Consumer demand for new vehicles remains steady with vehicle sales totaling to 1.46 million in August 2025, an increase of 5% from the previous month.

U.S. Automotive Production

U.S. Auto Production Increased Slightly in July 2025

In July 2025, U.S. auto production amounted to 113,200 units, an increase of almost 2% year-over-year.

Michigan Vehicle Production

Michigan Vehicle Production Decreased in July

Michigan motor vehicle production decreased in July to 138,683 units, 19.9 percent lower than June’s
production, and 4.6 percent higher than its year ago level. Nationally, motor vehicle production also
declined in July to 767,430 total units, or 15.9 percent lower than the prior month, but above its year ago
level by 8.3 percent. From June to July, Michigan’s car production declined from 9,915 units to 5,597,
while the State’s truck production declined from 163,195 units to 133,086.

Automotive Manufacturing Employment

Vehicle Manufacturing Employment Down in July 2025

Michigan’s automotive manufacturing employment totaled 158,400 in July 2025, down 1.5% month-over-month.