Statewide Poll Reveals Opinions on Underlying Economic Concerns, COVID-19 and Vaccination Perceptions, Voting Rights, Political Landscape
September 19, 2021View the full poll results here.
DETROIT (Sept. 20, 2021) – Today, the Detroit Regional Chamber released findings from a new statewide poll of registered voters in Michigan ahead of the 2021 Mackinac Policy Conference. The survey provides insight and data on Michiganders’ perceptions of the economy, how they have reacted to the distribution of COVID-19 vaccines, the ongoing public health and economic challenges, and critical political issues facing the state.
“In advance of the Mackinac Policy Conference and after conducting polls throughout the pandemic, the Chamber wanted to gauge how voters feel about Michigan’s health, economy, and political situation,” said Sandy K. Baruah, president and chief executive officer of the Detroit Regional Chamber. “The polling shows that the last 18 months have exacerbated divisions, and finding consensus on how to best control COVID-19 and move Michigan forward has become even more challenging. That is why events where business, civic, and government leaders can convene with civility like the Mackinac Policy Conference are so critical now.”
The Glengariff Group Inc., the Chamber’s polling partner, completed this statewide poll of 600 registered Michigan voters between Aug. 30 and Sept. 3, 2021. The poll’s findings reflect some continuity with previous Chamber surveys conducted throughout 2020. Still, there are new signs of concerns with the rise of the Delta variant of COVID-19, inflation, and uncertainty about how to best move forward with public health measures as a state.
“The divisions we have seen throughout the pandemic are becoming more pronounced. Republicans and Democrats fundamentally see different problems and different paths forward,” said Richard Czuba, president of Glengariff Group Inc. “Voters remained highly engaged and report a high motivation (9.1) to vote in the 2022 election, which indicates we are likely to see the same high level of turnout as in 2018 and 2020.”
The following are some key themes from the polling results:
Growing Concerns About the Nation’s Economic Conditions
With increasing inflationary signals and the Delta variant of COVID-19 causing a significant rise in cases, hospitalizations, and deaths throughout the country, Michigan voters are more concerned that the economy is on the wrong track.
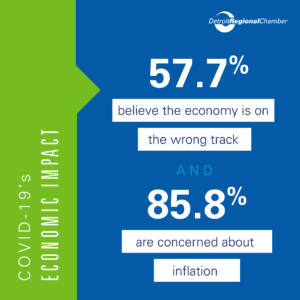
- By a margin of 31.8% right track to 57.7% wrong track, Michigan voters believe the economy is on the wrong track.
|
Party Affiliation Right Wrong Strong Democratic 56.5% 34.2% Lean Democratic 45.0% 35.0% Independent 24.8% 60.0% Lean Republican 17.0% 74.5% Strong Republican 13.1% 80.6% |
 |
 Among vaccinated voters, 40.9% say the economy is on the right track compared to 49.0% that say it is on the wrong track. But among unvaccinated voters, only 9.7% believe the economy is on the right track compared to 83.5% on the wrong track.
- Voters were asked to what degree they were or were not concerned about inflation. 85.8% of Michigan voters are concerned about inflation, with 12.6% not concerned.
- 52.8% of voters – a majority of voters – are very concerned about inflation, with 33.0% somewhat concerned about inflation.
|
Party Affiliation Very Concerned Somewhat Concerned Not Concerned Strong Democratic 30.6% 45.6% 21.8% Lean Democratic 42.5% 42.5% 15.0% Independent 58.4% 29.6% 11.2% Lean Republican 66.0% 25.0% 6.4% Strong Republican 73.7% 20.6% 4.6% |
Chamber Perspective: The persistence of COVID-19 is having a detrimental impact on supply chains and labor markets, contributing to a multi-quarter inflationary cycle. The data shows that most voters (52.8%) are very concerned about inflation, and there is bipartisan concern from every demographic group. For economic perceptions to rebound, significant progress is needed to stop the spread of the pandemic.
Impact of COVID-19 on Personal Economies Decreases, but Disparities Remain
- Voters described COVID-19’s impact on their household finances. The numbers on the left look at Sept. 2021 compared with May 2021, December 2020, and May 2020. One in six voters continues to deal with catastrophic or major effects on their household finances.
|
Sept. 2021 May 2021 Dec. 2020 May 2020 Effect 4.8% 3.0% 6.2% 5.0% Catastrophic 12.3% 12.8% 18.0% 18.8% Major effect 37.5% 34.8% 34.2% 46.3% Minor effect 44.8% 48.7% 41.0% 27.7% No effect |
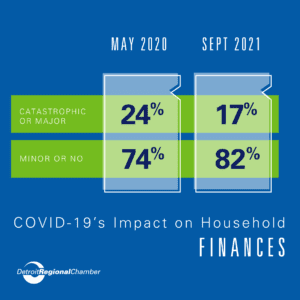 |
Chamber Perspective: The Chamber notes that while 82.3% of voters report no effect or minor impact, the adverse effects of the pandemic did not fall equally across our society.
The uneven and unequal K-shaped recovery has been most prominently felt by Black communities, people of color, and 18-29-year-olds. 32.6% of Black voters report catastrophic or major financial damage compared to 14.1% for white voters. There continues to be a direct relationship between financial damage and age, with voters under 50 far more likely to experience financial hardship.
Age Catastrophic/Major
18-29 21.3%
30-39 21.2%
40-49 20.5%
50-64 14.2%
65+ 10.4%
Among voters that were employed prior to the pandemic:
- 6% are still in the same job.
- 0% are employed in a different job.
- 0% are currently looking for work.
- 5% have moved to retirement or disability.
- 7% are no longer looking for work.
- 0% are waiting to be called back to their old job.
Chamber Perspective: There are multiple causes for the labor shortage impacting Michigan, but our polling data found that 28.0% of those aged 65 and older that were working prior to the pandemic are no longer working. 8.1% of those 50-64 that were working before the pandemic are no longer working.
Michigan Voters’ Perceptions on Vaccinations
- The percentage of voters who will not get vaccinated has remained steady throughout the year. 17.2% of respondents said they do not plan to get vaccinated, and another 4.8% said they cannot get vaccinated for medical reasons.
- 66% of survey respondents said that they had received at least one shot, which is in line with data from the Michigan Department of Health and Human Services.
- For those that are vaccinated, 72.7% said they planned to get a booster shot when it is available.
- 6% of the vaccinated said they would not get the booster.
- 7% said they are not sure if they would get the booster.
- 7% of voters said they will eventually get vaccinated.
Chamber Perspective: 72.7% of voters said they have received at least one shot or have a plan to be vaccinated, which represents a substantial increase from the 52.5% that said they would in the Chamber’s December poll. However, this number has actually fallen from 77% in the May poll, reflecting the stagnation of interest in vaccination and makes it more likely COVID-19 will ultimately transition from a pandemic to an endemic that our public health system will always have to deal with.
What Michiganders Make Up the “Likely to Get Vaccinated” Respondents
- 0% of the likely to be vaccinated are under the age of 40.
- 0% of the likely to be vaccinated do not have a college degree.
- 0% are in Metro Detroit and 40% are in out-state Michigan.
- 25% get their news from local television news and 30% get their news from social media or other websites.
- The likely to be vaccinated are equally spread by party affiliation.
Why the “Likely to Get Vaccinated” Group Waited
- 5% said there has not been enough testing and/or research.
- 0% said they have not had the time to get it yet.
- 5% said they do not think it is safe or do not trust it.
- 0% said there is not enough information or they are worried.
- 0% said they are not sure they need it because they had COVID-19.
- 0% said they are waiting for FDA approval.
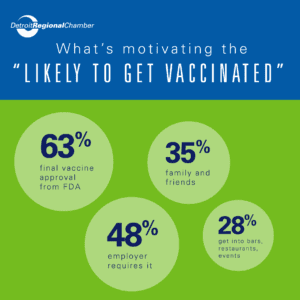
Chamber Perspective: 66.4% of Michigan adults have received at least one dose of the COVID-19 vaccine, which remains short of the state’s goal of 70%. Understanding what motivates the 6.7% of Michiganders who say they will likely get the vaccine but have not yet will be important in achieving herd immunity. Almost two-thirds of this group said that final vaccine approval from the FDA would make them more likely, followed by just under half saying their employer requiring it would motivate them.
- Voters who are ‘likely to be vaccinated’ were asked if they would be more or less likely to get vaccinated under four scenarios. The most powerful motivator of this voter block is the vaccine receiving final approval from the FDA.
- 62.5% More Likely Final vaccine approval from the FDA.
- 47.5% More Likely Employer requires it.
- 35.0% More Likely Family and friend require it to spend time with them.
- 27.5% More Likely Get into places you enjoy like restaurants, bars, or events.
Challenges to Increasing Vaccinations
- Out of the 17.2% of voters that said they do not plan to get vaccinated, three-quarters are under the age of 50, a significant majority don’t have a college degree (71%), and 70% identify as Republican. Additionally, two-thirds live in ‘out-state Michigan’, 64% are men, and 40% get their news from social media or websites.
- When asked why they did not plan to get the vaccine:
- 1% said they had COVID-19 and their immune system was strong.
- 5% said it was rushed and not enough testing was done.
- 5% said they are opposed to vaccines.
- 6% said they do not believe in it.
- 7% said it is not safe.
- 9% said COVID-19 is a lie, all fake.
- 9% said there is not enough information on it.
- Perhaps most alarmingly, 17.7% of Michigan voters said getting the vaccine was a bigger risk than contracting COVID-19. 30.3% of those aged 30-39 and 23.0% those aged 40-49 believe the vaccine is a bigger risk.
Challenges to Finding a Consensus on Vaccination Mandates
Vaccine Requirements for Employment
- Voters were asked if they support or oppose allowing businesses to require proof of vaccination for employees or customers.
- 44.0% would support the vaccine requirement, while 51.9% would oppose the vaccine requirement.
- 28.8% strongly support allowing the requirement. But 41.7% strongly oppose allowing the requirement.
- There is a particularly sharp difference by age, with only voters over the age of 65 supporting proof of vaccination requirements.
Age Support Oppose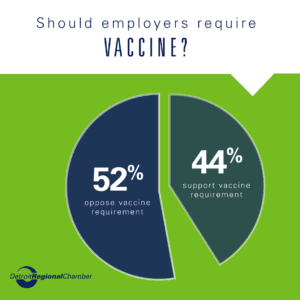
18-29 35.0% 61.3%
30-39 32.0% 67.2%
40-49 35.2% 59.0%
50-64 43.2% 54.7%
65+ 69.4% 23.1%
- Republican and Independent voters sharply oppose proof of vaccination requirements, while Democratic voters strongly support vaccination requirements.
Party Support Oppose
Strong Democrat 74.6% 19.7%
Lean Democrat 70.0% 25.0%
Independent 32.8% 62.4%
Lean Republican 27.6% 72.4%
Strong Republican 18.8% 78.8%
Perceptions on Legislation to Prohibit Employers from Requiring Employee Vaccination
In August, Chamber vice president of government relations, Brad Williams, testified before the Michigan House Committee on Workforce, Trades, and Talent against House Bill 4471, which would restrict businesses from making their own decisions about requiring vaccines and masks. The Chamber advocates against big government restrictions that can impede an employer’s ability to operate safely and responsibly. Business groups joined the Chamber from around the state in opposing this legislation.
- Employed voters were asked if they support or oppose proposed legislation that would prohibit private employers from requiring that employees get vaccinated as a condition of employment.
- 9% support the legislation.
- 8% oppose the legislation.
- Republicans narrowly support the legislation, while Democrats narrowly oppose the legislation. But unlike other issues, all party affiliations are largely split on the proposal.
Even by vaccination status, employed voters appear split on the proposal.
Vax Status Support Oppose
Vaccinated 42.5% 50.0%
Will Vax 40.7% 51.8%
No Vax 61.9% 36.8%
Chamber Perspective: The Chamber strongly opposes legislation that restricts businesses’ ability to operate and make decisions that are best for their employees and customers. The Chamber also opposes the proposed Labor Department rule that would require all businesses with more than 100 employees to be vaccinated.
The Chamber advocates for a plan that would incentivize businesses of all sizes to vaccinate their employees. The best way out of the pandemic is vaccinations.
- Employed voters that oppose the prohibition and support mandatory vaccinations were asked if they would look for another job if their employer did NOT require vaccinations. 15.5% of those employees said they would look for another job, while 77.4% said they would not look for another job.
- Employed voters that support the prohibition and oppose mandatory vaccinations were asked if they would look for another job if their employer DID require vaccinations. 4% of those employees said they would look for another job, while 48.8% said they would not look for another job.
- 89.4% of unvaccinated workers that support the prohibition on mandatory vaccinations said they would look for another job if their employer required vaccinations. Only 13.2% of vaccinated workers that oppose prohibiting mandatory vaccinations said they would look for another job if their employer did not require vaccinations.
Chamber Perspective: Vaccines remain the most effective pathway out of the pandemic; however, businesses need to build consensus with their staff before implementing any mandates. Sentiment on vaccination mandates is highly divisive, and in the midst of a labor shortage, mandates could further exacerbate human resources challenges.
Vaccine Requirements to Enter a Business
- Voters were read two different statements and asked which one better reflected their position on the vaccine.
- 51.2% chose, “I do not support vaccine restrictions to enter businesses. Getting a vaccine should be an individual choice.”
- 44.0% chose, “I support vaccine requirements to enter businesses. If you choose not to get vaccinated, you should not be allowed to put everyone else’s health at risk.”
- 92.2% of unvaccinated respondents oppose restrictions to enter businesses, and 72.5% of those voters still willing to get vaccinated oppose business restrictions. However, vaccinated voters support business restrictions by a margin of 60.6%-33.1%.
Vaccine Mandates
- Voters were read three different statements and asked which one most accurately reflected their position.
- 51.8% chose, “I believe vaccinations are an individual choice and respect the decision of people who choose not to get vaccinated.”
- 40.2% chose, “We could end this pandemic if people just got vaccinated. I am angry that people refuse to get vaccinated and are prolonging COVID-19.”
- 6.5% chose, “I do not believe in the COVID-19 vaccine and believe we should let nature take its course.”
- Among unvaccinated voters:
- 72.8% believe it is an individual choice.
- 25.2% believe we should let nature take its course.
- 1.0% said we could just end the pandemic if people got vaccinated.
- Among vaccinated voters:
- 59.6% believe we could just end the pandemic if people got vaccinated.
- 37.4% believe it is an individual choice.
- 1.5% believe we should let nature take its course.
- By a margin of 61.6%-30.4%, Independent voters believe vaccination is an individual choice.
Economic Benefits of Vaccination Proof Depends on Region/Clientele
- Voters were asked if they would be more or less likely to go to seven different locations if that location required proof of vaccination. Of the seven venues, only bars would be relatively split at 28.3% more likely and 31.8% less likely.
- At five of the venues, voters would be more likely to attend by narrow margins: restaurants, small businesses, movie theaters, concerts, and sporting facilities. Only airline travel could see a considerable benefit, with 43.5% more likely and 24.5% less likely.
Venue More Less Doesn’t Matter Wouldn’t Go
Restaurants 37.7% 32.5% 13.0% 15.2%
Bars 28.3% 31.8% 14.2% 24.5%
Small Businesses 37.5% 31.0% 15.3% 14.7%
Movie Theaters 35.2% 29.7% 13.8% 20.0%
Concerts/Theaters 36.7% 27.9% 12.0% 22.0%
Sporting Facilities 35.8% 28.4% 12.7% 21.3%
Flying by Airplane 43.5% 24.5% 12.7% 18.2%
- But the reality is that the economic benefits of a vaccination requirement will depend squarely on the location of the establishment and the partisan affiliation of its clientele.
The charts below compare those more willing and less willing to attend each venue based on partisan affiliation.
Venue Democratic Independent Republican
More Less More Less More Less
Restaurants 65.3% 11.4% 28.0% 44.8% 14.9% 45.7%
Bars 51.8% 9.8% 20.0% 25.0% 8.3% 38.9%
Small Businesses 66.8% 10.3% 24.8% 43.1% 15.5% 42.8%
Movies 65.3% 11.4% 24.0% 38.4% 12.6% 40.0%
Concerts/Theaters 63.7% 8.3% 26.4% 40.0% 13.7% 38.3%
Sporting Facilities 63.7% 8.3% 24.0% 39.7% 14.3% 39.5%
Air Travel 71.5% 5.7% 31.2% 36.0% 24.5% 32.0%
The chart below does the same comparison by Metro Detroit versus out-state voters.
Venue Metro Detroit Out-State
More Less More Less
Restaurants 43.4% 31.4% 32.2% 33.5%
Bars 32.7% 29.7% 25.1% 29.9%
Small Businesses 43.7% 30.0% 31.6% 31.9%
Movies 40.3% 30.7% 30.3% 28.7%
Concerts/Theaters 40.6% 28.6% 32.9% 28.0%
Sporting Facilities 40.0% 28.0% 31.9% 28.6%
Air Travel 48.4% 23.3% 37.8% 23.8%
Chamber Perspective: In the Chamber’s December 2020 poll, voters overwhelmingly said that supporting small businesses was the most important thing governmental leaders should focus on to support an economic recovery. Businesses have no interest in being part of a partisan battle over COVID-19, but they have been drawn into the all-encompassing discourse of how to navigate the pandemic. Now is the time to turn down the rhetoric on both sides and work towards solutions for ending the pandemic and sustaining a broad-based recovery.
Challenges to Finding a Consensus on Public Health Measures
Mask Requirements in Public Buildings
- By a margin of 57.3%-35.2%, Michigan voters support requiring people to wear masks in public buildings until the Delta variant subsides. 42.5% strongly support the mask requirement while 24.0% strongly oppose the requirement.
- Support for mask requirements is 71.0%-23.0% among those that are already vaccinated. Among those that will get vaccinated at some point, support for mask requirements is 57.5%-32.3%. But among those that will not get vaccinated, opposition to the mask requirement is 80.6%, with only 14.5% in support.
- Only Republican voters oppose the mask requirements at 25.7% support to 65.2% oppose. Democratic voters support the requirement 92.4%-4.2% and Independent voters support the mask requirement 54.4%-32.8%.
School Requirement When Vaccines Approved for Children
- By a margin of 55.1%-38.2%, Michigan voters support requiring children to be vaccinated for COVID-19 once the FDA approves the vaccine for children, just like they are required to do for polio, rubella, measles, and chicken pox.
- 40.8% of voters strongly support the requirement while 38.2% strongly oppose the requirement.
- Among those that are vaccinated, support for a school requirement is 66.3%-17.7%. Among those that are not vaccinated, they oppose the requirement by a margin of 7.8%-87.4%.
- Parents with children oppose the requirement by a margin of 38.1%-55.7%. But voters without children support the requirement by a margin of 65.0%-28.0%.
School Requirement for Masking
- 53.2% said the government or the school district should make the decision. 37.5% of voters said parents should make the decision.
- Among voters that have children, 46.2% said parents should make the decision. 30.1% said state or local health departments should make the decision. 15.2% said schools should make the decision.
Update on Michigan Voter Perceptions on Voting Rights and Reform
Michiganders Support Protecting Voting Rights and Election Security
 In early April, Michigan House Republicans introduced 39 bills that focused on voting process and access. The Chamber has long advocated for smart voting reforms, such as supporting no-reason absentee voting and same-day voter registration, and has taken a stand supporting the validity of the 2020 election.
Some of the measures make common sense improvements and will make the voting process stronger. However, the Chamber issued a statement on April 12, which opposes efforts that unreasonably impact its members and their employees’ ability to exercise this franchise. The Chamber’s position is reflective of how the vast majority of Michigan voters feel.
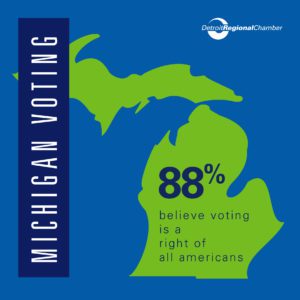
88.0% Believe Voting is a Right of All Americans
- Voters were asked if they believe voting is a right for all Americans or is voting a privilege that should be earned? 88.0% believe voting is a right of all Americans. 7.8% believe voting is a privilege to be earned.
- 17.1% of Strong Republican voters believe voting is a privilege to be earned.
- 12.9% of rural voters believe voting is a privilege.
- 12.1% of high school-educated voters believe voting is a privilege.
- 21.5% of Republican men believe that voting is a privilege.
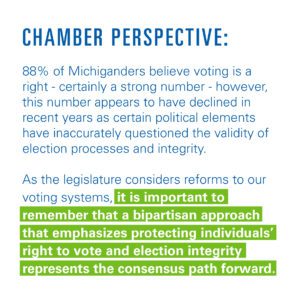 Chamber Perspective: The data indicates that Michiganders overwhelmingly believe that voting is a right for all Americans. As the legislature considers reforms to our voting system, it is important to remember that a bipartisan approach that emphasizes protecting individuals’ right to vote and election integrity represents the consensus path forward.
Understanding Michigan Voter Perceptions on the Political Landscape
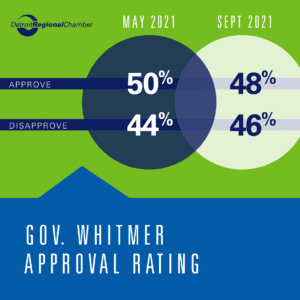
- By a margin of 47.9%-46.3%, Michigan voters very narrowly approve of Gov. Gretchen Whitmer’s performance. 5.8% of voters have no opinion of her performance.
Whitmer Job Approval Approve Disapprove
January 2020 43.3% 35.9%
September 2020 58.7% 38.3%
October 2020 59.1% 37.2%
February 2021 57.8% 38.1%
May 2021 50.0% 43.8%
September 2021 47.9% 46.3%
- Whitmer has continued to maintain strong support among Democratic and Leaning Democratic voters. Her job approval is 11% higher among Independent voters than Biden’s support among Independent voters.
- But the longer-term downward shift from her higher 2020 job approval numbers has occurred among Independent voters, where she has now dropped to 39.2% approve to 51.2% disapprove.
Party Affiliation Approve Disapprove
Strong Democratic 91.1% 4.6%
Lean Democratic 80.0% 7.5%
Independent 39.2% 51.2%
Lean Republican 19.1% 80.8%
Strong Republican 9.1% 88.0%
2022 Motivation to Vote Continues to look like 2018 and 2020
- Voters were asked on a scale of one to 10, how motivated they were to vote in the November 2022 election for Governor. Voter motivation continues at 2018 and 2020 levels coming in at 9.1 on a 10.0-point scale.
Party Affiliation Motivation to Vote
Strong Democratic 9.2
Lean Democratic 8.9
Independent 9.0
Lean Republican 9.3
Strong Republican 9.2
- The only ‘weakness’ in the motivation numbers at this point is among 18-29-year-old voters who come in at an 8.1 – similar motivation levels to 2018 and 2020.
 Biden Job Approval Falls Sharply
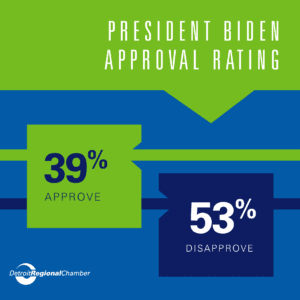
- Joe Biden’s Michigan job approval is 39.0% approve to 53.0% disapprove. 8.0% of voters have no opinion of Biden’s performance. While 22.0% strongly approve of Biden’s performance, 44.5% strongly disapprove of his performance.
- The drop of Biden’s performance numbers come from Leaning Democratic voters, where approval declined by 32.3% and Independent voters, where approval dropped by 10.9%.
Party Affiliation Approve Disapprove Drop in Approval from May 2021
Strong Democratic 83.9% 9.8% -8.1%
Lean Democratic 55.0% 27.5% -32.3%
Independent 28.0% 56.8% -10.9%
Lean Republican 8.5% 87.2% -0.7%
Strong Republican 4.0% 93.7% -0.6%
- By a margin of 25.5%-58.5%, Michigan voters believe the nation is on the wrong track. The right track/wrong track number has fallen back to October 2020 levels.
Survey Right Wrong No Opinion
October 2020 27.4% 55.9% 16.7%
February 2021 36.6% 40.6% 22.9%
May 2021 35.3% 48.2% 16.5%
September 2021 25.5% 58.5% 16.0%
- The national right track/wrong track shift has occurred because of Democratic voters moving from 69.9% right track to 51.8% right track.
Party Affiliation Right Wrong Right Track Decline Since May 2021
Strong Democratic 51.8% 26.4% -17.1%
Lean Democratic 42.5% 32.5% -11.5%
Independent 21.6% 60.0% -7.3%
Lean Republican 8.5% 83.0% -2.3%
Strong Republican 2.9% 92.0% -1.7%
- By a margin of 38.7% right track to 47.2% wrong track, Michigan voters believe the state is on the wrong track. While the national numbers have dropped, the Michigan right track/wrong track number remain statistically unchanged from May 2021.
Survey Right Wrong
January 2020 44.5% 26.2%
October 2020 44.9% 41.3%
February 2021 46.6% 38.9%
May 2021 40.4% 45.2%
September 2021 38.7% 47.2%
###