Statewide Poll Reveals Opinions on Underlying Economic Concerns, Inflation, COVID-19 and Vaccination Perceptions, Voting Rights, Political Landscape
December 15, 2021DETROIT (Dec. 15, 2021) – Today, the Detroit Regional Chamber released findings from a new statewide poll of registered voters in Michigan. The survey provides insight and data on Michiganders’ perceptions of the economy, how inflation has impacted their assessment, ongoing challenges with COVID-19, vaccination, voting rights, and the political landscape going into the 2022 midterms.
“Two years into the global pandemic, the Chamber continues to go inside Michigan households and businesses to assess how voters feel about the state’s health, economy, and political situation,” said Sandy K. Baruah, president and chief executive officer of the Chamber. “The polling shows a growing disconnect between personal consumer behavior and concern over inflation. Voters, while confident of their own job security and finances, are pessimistic about the overall state of the economy in large part due to inflation, which many have never experienced in their lifetimes.”
The Glengariff Group Inc., the Chamber’s polling partner, completed this statewide poll of 600 registered Michigan voters between Nov. 29 and Dec. 3, 2021. The poll’s findings reflect some continuity with previous Chamber surveys conducted throughout the past two years. However, a growing number of Michiganders believe the nation is on the wrong track, as Delta drives a virulent fourth wave of infections in the state, inflation continues to rise, and uncertainties remain about what public health measures are appropriate to meet these challenges.
“Political opposition to vaccinations has not shifted with more than one in four Republican voters not getting vaccinated and more than half of Republican parents not willing to get their 5-11-year-old child vaccinated,” said Richard Czuba, president of Glengariff Group Inc. “Opposition continues to be strongest in rural regions with non-college-educated voters providing the kindling we are now seeing in the fourth wave to infections burning through Michigan.”
The following are some key themes from the polling results:
Jump to:
- Economic Concerns and Inflation
- COVID-19 and Vaccination Perceptions
- Voting Rights and Reform
- Perceptions of Political Landscape
Despite Some Strong Indicators, There are Deep Concerns About the Nation’s Economy
 Many of the most common measures signal that the U.S. economy has not just recovered from the depths of March and April 2020, but is in fact, booming. More than five million jobs have been added since January of 2021, additional employment opportunities are readily available to anyone looking for work, and the nation’s economic output continues to grow. However, data from the Bureau of Labor Statistics released on Friday, Dec. 10, show that the federal Consumer Price Index — the government’s measure of inflation — is increasing at the highest 12-month rate in 39 years. While personal consumer behavior and other macro indicators point toward robust growth, a growing number of Michiganders believe the economy is on the wrong track.
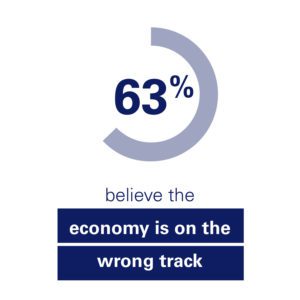
- Voters believe the nation’s economy is on the wrong track by a margin of 27.0% right track to 63.0% wrong track.
- Only Strong Democratic voters believe the economy is on the right track. All other demographic groups believe the economy is on the wrong track.
| Party Affiliation | Right | Wrong |
| Strong Democratic | 51.5% | 35.7% |
| Lean Democratic | 40.0% | 48.9% |
| Independent | 21.9% | 65.7% |
| Lean Republican | 14.9% | 83.6% |
| Strong Republican | 7.5% | 85.7% |
- Political affiliation also impacted perceptions of how the economy would perform in the future.
- Strong Democratic voters believe the economy will get better by a margin of 52.0% better to 12.3% worse, with 29.8% saying it will stay the same.
- Strong Republican voters believe the economy will get worse by a margin of 60.5% worse to 10.2% better, with 17.7% saying it will stay the same.
- Independent voters are pessimistic, with 24.8% saying it will get better, 37.2% saying it will get worse, and 28.5% saying it will stay the same.
Voters were asked if the economy would get better, get worse, or stay about the same next year.
- 37.5% Get Worse
- 29.7% Get Better
- 24.3% Stay About the Same
| Chamber Perspective: Despite overall economic news, concerns over inflation have had a detrimental impact on economic perceptions. The pessimism that many individuals feel about the economy contrasts with personal consumer behavior. With savings holding steady, spending up in 2021, and individuals secure in their employment, it is clear that many Michiganders feel comfortable with their economic circumstance but will not feel optimistic about the broader economy until the pandemic and its effects subside. |
Negative Perception of Macro Conditions Not Reflected by Personal Economic Circumstances
For most voters, the negative attitude toward the broader economy is not reflected by how they feel their personal economic circumstances have fared.
- 48.0% of voters say they are economically about the same as in the past.
- 25.5% of voters say they are better off than in the past.
- 24.3% of voters say they are worse off than in the past.
Even among Strong Republican voters that are sharply negative about the economy, they say their economic situation has remained the same or improved by a 2-1 margin 61.9% better or the same versus 38.1% worse.
| Party Affiliation | Better | Worse | Same |
| Strong Democratic | 38.2% | 12.3% | 48.0% |
| Lean Democratic | 28.9% | 11.1% | 60.0% |
| Independent | 21.2% | 31.4% | 44.9% |
| Lean Republican | 19.4% | 35.8% | 48.1% |
| Strong Republican | 17.0% | 38.1% | 44.9% |
In addition to Strong Democratic voters, voters under 40, college-educated voters and Black voters are the more likely to say their economic situation has improved.
Inflation Driving Voters’ Concerns About Economy
| Chamber Perspective: The data shows that individual situations correlate with how voters perceive the economy. Many voters whose personal economic situation has improved are split on their views of the overall economy, with 48.4% believing it is on the wrong track. However, for voters who report not doing as well since the pandemic, 85.3% believe the economy is on the wrong track. |
- Voters who said the economy was on the wrong track were asked in an open-ended question, specifically WHY they felt the economy was on the wrong track.
- 36.6% Inflation/cost of goods
- 21.9% General Anti-Biden/Anti-Democrats
- 12.1% Nobody wants to work
- 8.1% Wages are too low/Not paying enough
- 4.6% COVID-19-related concerns
- 4.0% There are no good jobs/Unemployment
- 3.5% High cost of gas prices
- 3.5% Government response to COVID-19
- 3.2% There are not enough workers
- 2.6% Supply chain issues/Cannot get anything
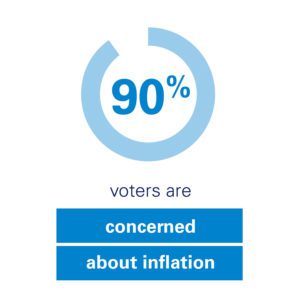 89.9% of voters say they are concerned about inflation, while only 8.6% say they are not concerned. 58.2% of voters say they are very concerned about inflation.
- Voters were read a list of seven different purchases and asked if they personally have or have not seen a big increase in the cost of that item over the past year.
- 93.2% Gas for your automobile
- 89.7% Groceries
- 68.0% Eating out at a restaurant
- 53.8% Home heating costs
- 51.7% Vehicle purchase
- 39.2% Insurance
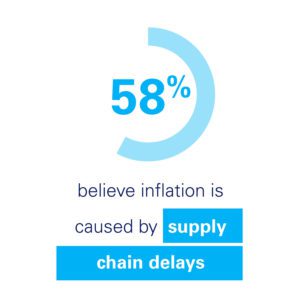
- 58.0% of voters believe supply chain delays are the main cause of inflation compared to 35.5% that believe inflation is being caused by something else. 6.8% said they did not know what was causing inflation.
- Supply chain delays
- 15.8% Joe Biden and the Democrats
- 6.8% Do not know
- 4.0% Stimulus checks
- 2.7% Corporate greed
- 12.7% Miscellaneous responses below 2.0%
| Chamber Perspective: While other economic indicators are very strong, personal concerns over inflation have negatively colored the perception of the economy. Partisanship and political affiliation have a clear impact on what is driving concerns about the economy. Large majorities of Democratic and Independent voters believe supply chain issues are causing inflation. However, among Republican voters, the most often cited alternative reason for inflation was “Joe Biden and the Democrats.” For economic perceptions to rebound, significant progress is needed to halt the rise of inflation and the continued spread of COVID-19; however, partisanship could remain a longer-term impediment. |
Supply Chain Issues Have Caused Shortages
- 64.7% of voters said they have had to wait on something they wanted to buy in the past six months because of supply chain issues.
- When asked what specifically they had to wait to purchase (respondents could offer more than one item):
- 19.1% Building and repair materials
- 16.5% Groceries/Food
- 14.9% Furniture
- 13.7% Large appliances
- 11.6% Electronics/Computers
- 10.1% Vehicle
- 8.2% Clothing/Shoes
- 6.7% Paper products
- 5.9% Recreational items/Toys/Gifts
- 5.7% Car parts
- 5.2% Gaming consoles/Video games
- 3.9% Home goods
| Chamber Perspective: The persistence of COVID-19 is having a detrimental impact on supply chains and labor markets, contributing to a multi-quarter inflationary cycle. Consumer spending is also having an impact on various sectors of the economy. The 2020 drop in spending on services and rapid increase in spending on goods further disrupted supply chains, which have led to a spike in prices for many consumer products. |
Most Workers Feel Secure in Their Jobs
- Perceptions about the labor market and specifically job security remain healthy. Among voters that currently hold jobs, 16.1% are concerned about losing their jobs while 82.6% said they are not concerned about losing their jobs.
- 5.6% Very concerned
- 10.5% Somewhat concerned
- 13.4% Not very concerned
- 69.2% Not concerned at all
- However, there were sharp differences about job security based on the worker’s location of residence with small town and rural workers more than twice as concerned about losing their job as urban and suburban workers.
| Type of Town | Concerned | Not Concerned |
| Urban | 8.5% | 88.5% |
| Suburban | 13.0% | 85.5% |
| Small Town | 20.5% | 78.2% |
| Rural | 22.2% | 77.7% |
- Voters that are concerned with losing their jobs were asked what specifically made them concerned.
- 26.7% The current economy and lack of business
- 21.7% Effect of COVID-19/COVID-19 mandates
- 11.7% Inflation
- 10.0% Uncertain future
- 8.3% Lack of employees/Worker shortage
- 5.0% Changes in my industry
- 5.0% Contract employee
- 3.3% Supply chain limitations
The Great Resignation and Labor Force Participation
- 6.5% of workers employed prior to COVID-19 have now left the workforce, with 5.1% saying they have retired or gone on disability and 1.4% saying they are no longer looking for work. [These numbers represent a minor change within the margin of error from the September 2021 survey, which showed that 3.5% had moved to retirement and 1.7%. were no longer looking for work.]
- Only 9.5% of those who have retired (5.1%) said they were likely to take another job in the next year.
- 66.7% of those no longer looking for work (1.4%) said they were likely to take another job in the next year.
- Voters were asked if they support or oppose increasing LEGAL immigration to help fill the labor shortage in Michigan. By a margin of 56.0% support to 35.6% oppose, a majority of Michigan voters support increasing legal immigration in Michigan. 35.8% strongly support increasing legal immigration, while 26.3% strongly oppose increasing legal immigration.
- Only Strong Republican voters oppose increasing legal immigration to fill Michigan’s labor shortage.
| Party Affiliation | Support | Oppose |
| Strong Democratic | 76.0% | 16.9% |
| Lean Democratic | 66.7% | 31.1% |
| Independent | 51.9% | 36.5% |
| Lean Republican | 58.2% | 32.9% |
| Strong Republican | 39.4% | 53.7% |
- However, there are statistically significant differences based on education levels of voters.
| Education Attainment | Support | Oppose |
| High School | 47.1% | 48.0% |
| Some Post Education | 52.0% | 39.3% |
| College | 63.4% | 26.5% |
| Chamber Perspective: Prior to the pandemic, Michigan’s labor force participation rate was 61.6% (according to data from the Bureau of Labor Statistics), and despite recovering from the depths of the COVID-19 recession, the rate remains more than 2% lower at 59.3%. This drop appears to be most concentrated among workers over 50. There has been a 4.7% decrease in the labor participation rate among workers over 65 and 8.1% for 50-64-year-old workers. The decline in labor participation among senior employees is having a ripple effect on the labor market as businesses try to promote or recruit new talent away from other industries or sectors, which contributes to the churn of workers driving the “Great Resignation.” |
Challenges Continue with COVID-19 and Michigan Voters’ Perceptions on Vaccinations
- 72.2% of survey respondents reported receiving at least ONE vaccination shot for COVID-19.
- 3.8% have received one shot.
- 69.0% of respondents have received both vaccine shots.
- 33.0% of respondents have received both shots, PLUS a booster shot.
- 4.5% of respondents said they plan to get vaccinated but have not done so yet.
- 3.7% of respondents said they cannot get the vaccine for medical reasons.
- 15.5% of respondents said they do not plan to get vaccinated.
- 3.5% of respondents do not know or refused to answer.
- Among the 69% that are fully vaccinated, 63.9% said they have/will get the booster shot. 17.6% of those vaccinated said they will not get the booster shot. 18.5% of those fully vaccinated said they are uncertain about getting the booster shot.
- The percentage of individuals that said they will, but have not yet, gotten vaccinated fell from 6.7% in September 2021 to 4.5% in December 2021, reflecting the small increase in new vaccinations this fall as the Delta variant spread.
- There continue to be sharp demographic differences among those voters that say they will not get the vaccine.
| Democratic Group | Percentage That Will Not Get Vaccinated |
| Strong Democratic | 2.9% |
| Lean Democratic | 0.0% |
| Independent | 16.8% |
| Lean Republican | 25.4% |
| Strong Republican | 28.6% |
| 18-29 | 25.3% |
| 30-39 | 18.5% |
| 40-49 | 26.1% |
| 50-64 | 9.9% |
| 65+ | 4.7% |
| Urban | 8.7% |
| Suburban | 9.7% |
| Small Town | 19.5% |
| Rural | 24.2% |
| High School | 26.9% |
| Some Post | 19.2% |
| College | 7.6% |
| Male | 19.8% |
| Female | 11.5% |
| White | 18.2% |
| Black | 3.6% |
| Chamber Perspective: 72.2% of voters said they have received at least one shot or have a plan to be vaccinated, which represents a substantial increase from the 52.5% that said they would in the Chamber’s December 2020 poll. However, this number has actually fallen from 77% in the May poll, reflecting the stagnation of interest in vaccination and makes it more likely COVID-19 will ultimately transition from a pandemic to an endemic that our public health system will always have to deal with. |
Perceptions on Vaccinations for Younger Children
- 35.7% Will not vaccinate child.
- 25.2% Has already been vaccinated.
- 10.4% Are currently waiting for an appointment to vaccinate.
- 18.2% Plan to wait to get their child vaccinated.
- 2.6% Said their child cannot be vaccinated for medical reasons.
- 7.8% Do not currently know if they will vaccinate their child.
- Political identification, education level, geography, and gender have an impact on whether a parent is inclined to vaccinate their 5-11-year-old child.
- A majority of Republican parents will not vaccinate their 5-11-year-old child against COVID-19.
| Party Affiliation | Will Not Vaccinate Child |
| Strong Democratic | 11.4% |
| Lean Democratic | 22.2% |
| Independent | 37.0% |
| Lean Republican | 62.5% |
| Strong Republican | 50.0% |
| Type of Town | Will Not Vaccinate Child |
| Urban | 31.6% |
| Suburban | 29.3% |
| Small Town | 37.8% |
| Rural | 48.0% |
| Education Attainment | Will Not Vaccinate Child |
| High School | 43.8% |
| Some Post | 46.1% |
| College | 26.7% |
- 44.2% of male parents said they will not vaccinate their child while only 28.6% of female parents said they will not vaccinate their child.
Managing the Ongoing Spread of the COVID-19 Delta Variant
Record levels of COVID-19 infections and hospitalizations have not brought about a consensus on how to stop the fourth wave of the pandemic in Michigan.
- 57.7% of Michigan voters believe COVID-19 rates would increase this winter. 12.2% said they would decrease. 20.5% said they would remain stable.
- Despite the widespread agreement that COVID-19 cases would continue to increase, voters are split on whether they are continuing to wear a mask in public places with 46.7% continuing to wear a mask and 45.7% saying they have stopped wearing a mask. 7.0% said it depends.
- There are sharp differences between which voters will and will not continue to wear masks driven by party affiliation, type of town, age, and gender. 77.4% of those who will not get vaccinated – the most vulnerable to COVID-19 – have stopped wearing masks.
| Demographic Group | Continue to Wear | Stop Wearing |
| Strong Democratic | 80.7% | 14.0% |
| Lean Democratic | 66.7% | 26.7% |
| Independent | 47.4% | 42.3% |
| Lean Republican | 20.9% | 73.1% |
| Strong Republican | 12.9% | 79.6% |
| Out-State | 39.7% | 51.9% |
| Metro Detroit | 54.2% | 38.9% |
| Urban | 66.0% | 27.2% |
| Suburban | 52.2% | 39.1% |
| Small Town | 39.1% | 52.6% |
| Rural | 32.2% | 61.1% |
| 18-29 | 41.3% | 48.0% |
| 30-39 | 42.6% | 49.1% |
| 40-49 | 42.6% | 49.6% |
| 50-64 | 41.0% | 33.6% |
| 65+ | 62.5% | 33.6% |
| Male | 34.7% | 57.6% |
| Female | 57.7% | 34.6% |
| White | 38.5% | 53.5% |
| Black | 86.7% | 8.4% |
| One Shot | 52.2% | 43.5% |
| Two Shots | 50.9% | 43.5% |
| Three Shots | 64.6% | 29.3% |
| Will Wait | 48.1% | 37.0% |
| Will Not Vaccinate | 9.7% | 77.4% |
| Chamber Perspective: Vaccines remain the most effective pathway out of the pandemic, and this winter, masking will help businesses keep their customers and employees healthy. |
Challenges to Finding a Consensus on Vaccination Mandates
- Voters were asked if a federal requirement that employers with 100+ employees require vaccinations would increase, decrease, or have no effect on vaccination rates.
- 46.8% said it would have no effect on vaccination rates.
- 41.0% said it would increase vaccination rates.
- 3.0% said it would decrease vaccination rates.
- 9.2% simply did not know.
- When asked if they support or oppose a requirement that employers with 100 or more employees must require COVID-19 vaccinations, Michigan voters were opposed by a margin of 40.5% support to 54.0% oppose. 30.8% strongly support the requirement, while 47.2% strongly oppose the requirement.
| Party Affiliation | Support | Oppose |
| Strong Democratic | 79.0% | 16.4% |
| Lean Democratic | 69.0% | 33.3% |
| Independent | 33.5% | 57.7% |
| Lean Republican | 14.9% | 80.6% |
| Strong Republican | 10.2% | 87.7% |
| Education Attainment | Support | Oppose |
| High School | 28.9% | 65.4% |
| Some Post | 32.8% | 61.2% |
| College | 51.5% | 42.6% |
- Workers in the labor force were asked what actions they would take if their employer did or did not mandate vaccinations.If their employer required vaccinations:
- 47.7% would support the decision and get vaccinated.
- 19.8% would oppose the decision and get vaccinated.
- 23.9% would oppose the decision and look for another job.
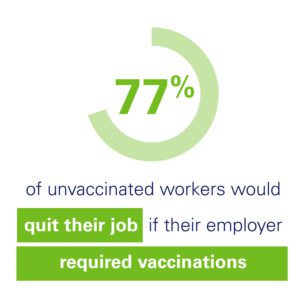 76.8% of workers that will not get vaccinated said they would look for another job; only 13.0% said they would get vaccinated but oppose the decision.
Conversely, workers were asked what their reaction would be if their employer did NOT require vaccinations.
-
-
- 50.9% said they would support the decision, but still get vaccinated.
- 27.6% said they would support the decision and not get vaccinated.
- 13.1% said they would oppose the decision but remain in their job.
- 2.4% said they would oppose the decision and look for another job.
-
While 2.4% of workers would look for another job if a vaccination was NOT required, 23.9% would look for another job if a vaccine WAS required.
Requiring a vaccination would lead to a vaccination rate among workers of 67.5%. Not requiring a vaccination would lead to a vaccination rate among workers of 66.4%.
| Chamber Perspective: The Chamber opposes the Occupational Safety and Health Administration rule that would require all businesses with more than 100 employees to be vaccinated. Federal mandates on vaccinations are a divisive political issue, which reflects why it is critical for businesses to build consensus with their staff before implementing any mandates. While many employees want the safety of a workplace where individuals are vaccinated, in the midst of a labor shortage, mandates could further exacerbate human resources challenges. |
Update on Michigan Voter Perceptions on Voting Rights and Reform
Michiganders Say Election Reform Should be Bipartisan
In early April, Michigan House Republicans introduced 39 bills that focused on voting process and access. The Chamber has long advocated for smart voting reforms, such as supporting no-reason absentee voting and same-day voter registration, and has taken a stand supporting the validity of the 2020 election.
Some of the measures make common sense improvements and will make the voting process stronger. However, the Chamber issued a statement on April 12, which opposes efforts that unreasonably impact its members and their employees’ ability to exercise this franchise. The Chamber’s position is reflective of how the vast majority of Michigan voters feel.
84.5% of Voters Say Election Changes Should be Bipartisan
- 84.5% of voters believe that changes to elections should only be approved if
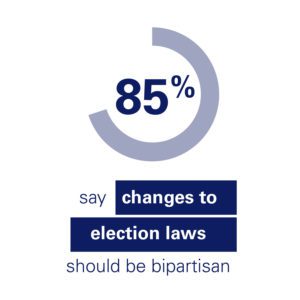 members of both parties can agree to the change. Only 5.7% of voters said whichever party has control of the State Legislature should be able to vote for the changes they support without input from the other side.
 - More than 77% of every demographic group believes changes to elections should have some bipartisan support.
- Voters were asked if they would support or oppose a proposed election law change that would prohibit local clerks from accepting donations from nonprofit organizations, including churches, from donating their space to communities to host local polling sites.
- By a margin of 17.2%-68.5%, Michigan voters overwhelmingly oppose a proposed change that would prohibit nonprofits from donating their space for polling sites. 50.0% of voters strongly oppose the prohibition.
| Party Affiliation | Support | Oppose |
| Strong Democratic | 19.3% | 71.3% |
| Lean Democratic | 20.0% | 64.5% |
| Independent | 18.3% | 70.1% |
| Lean Republican | 12.0% | 76.1% |
| Strong Republican | 17.7% | 64.6% |
| Chamber Perspective: Michiganders overwhelmingly believe that voting is a right for all Americans. As the legislature considers reforms to our voting system, it is important to remember that a bipartisan approach that emphasizes protecting individuals’ right to vote and election integrity represents the consensus path forward. |
Understanding Michigan Voter Perceptions on the Political Landscape
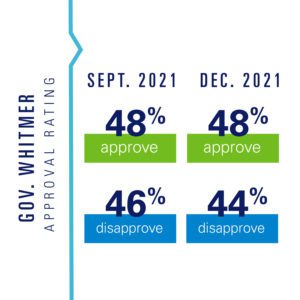 Gov. Whitmer’s Numbers Remain Steady
By a margin of 48.3%-43.8%, Michigan voters very narrowly approve of Gov. Gretchen Whitmer’s performance. 7.8% of voters have no opinion of her performance. This reflects a slight improvement in her standing with voters.
| Gov. Whitmer Job Approval | Approve | Disapprove |
| January 2020 | 43.3% | 35.9% |
| September 2020 | 58.7% | 38.3% |
| October 2020 | 59.1% | 37.2% |
| February 2021 | 57.8% | 38.1% |
| May 2021 | 50.0% | 43.8% |
| September 2021 | 47.9% | 46.3% |
| December 2021 | 48.3% | 43.8% |
There has been a notable shift in Gov. Whitmer’s job approval among Independent voters. In September 2021, Independent voters disapproved of Gov. Whitmer’s performance by a margin of 39.2% approve to 51.2% disapprove. Independent voters now approve of Gov. Whitmer’s performance by a margin of 46.0%-40.9%, a 17-point shift from -12% to +5.1%.
| Party Affiliation | Approve | Disapprove |
| Strong Democratic | 87.2% | 7.0% |
| Lean Democratic | 80.0% | 11.1% |
| Independent | 46.0% | 40.9% |
| Lean Republican | 23.9% | 65.6% |
2022 Motivation to Vote is High with Some Drop for Centrists Voters
Voters were asked on a scale of one to 10, how motivated they were to vote in the November 2022 election for governor. Voter motivation remains strong at 9.0 on a 10.0-point scale (a minor decline from 9.1 in September 2021). Motivation continues to be very high among the bases of both parties, but there appears to be some weakening of motivation among more centrist voters.
| Party Affiliation | Motivation to Vote |
| Strong Democratic | 9.3 |
| Lean Democratic | 8.7 |
| Independent | 8.8 |
| Lean Republican | 8.9 |
| Strong Republican | 9.4 |
There is a sharp difference in motivation by age groups with voters under 40 far less motivated than voters over 40.
| Age | Motivation to Vote |
| 18-29 | 8.2 |
| 30-39 | 8.4 |
| 40-49 | 9.4 |
| 50-64 | 9.3 |
| 65+ | 9.7 |
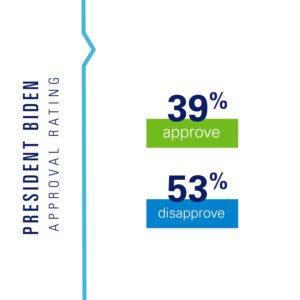
Biden Job Approval Falls Sharply
President Joe Biden’s job approval is 39.4% approve to 52.5% disapprove. 8.2% of voters have no opinion of President Biden’s performance. These numbers are statistically identical to September 2021. Only 18.2% of voters STRONGLY APPROVE of President Biden’s performance while 44.5% STRONGLY DISAPPROVE of his performance.
| Party Affiliation | Approve | Disapprove |
| Strong Democratic | 82.8% | 14.1% |
| Lean Democratic | 60.0% | 24.4% |
| Independent | 32.8% | 52.6% |
| Lean Republican | 6.0% | 83.6% |
| Strong Republican | 7.5% | 91.1% |
Voters Narrowly Approve of Their Own Member of Congress
- Voters were asked if they approve or disapprove of their own member of Congress. By a margin of 38.2% approve to 30.9% disapprove, voters narrowly approve of their member. But a large percentage (31.0%) of voters have no opinion of their member of Congress.
- Democratic voters are much more approving of their members of Congress than Republican voters. Republican voters disapprove of their own members of Congress by 15.4%.
| Party Affiliation | Approve | Disapprove |
| Strong Democratic | 55.0% | 21.0% |
| Lean Democratic | 60.0% | 15.6% |
| Independent | 35.0% | 34.3% |
| Lean Republican | 27.4% | 34.3% |
| Strong Republican | 23.8% | 39.4% |
- Rural voters – who are largely represented by Republicans in Congress – disapprove of their own member of Congress by a margin of 29.5% approve to 37.6% disapprove.
| Type of Town | Approve | Disapprove |
| Urban | 50.5% | 24.3% |
| Suburban | 39.1% | 30.4% |
| Small Town | 36.1% | 28.5% |
| Rural | 29.5% | 37.6% |
- By a margin of 22.8%-62.2%, Michigan voters believe the nation is on the wrong track. The right track/wrong track number is now at its lowest level of the pandemic.
| Survey | Right | Wrong | No Opinion |
| October 202 | 27.4% | 55.9% | 16.7% |
| February 2021 | 36.6% | 40.6% | 22.9% |
| May 2021 | 35.3% | 48.2% | 16.5% |
| September 2021 | 25.5% | 58.5% | 16.0% |
| December 2021 | 22.8% | 62.2% | 15.0% |
- The right track number continues to decline because Democratic voters continue to move away from the right track.
| Party Affiliation | Right | Wrong |
| Strong Democratic | 45.0% | 34.5% |
| Lean Democratic | 40.0% | 35.6% |
| Independent | 19.7% | 63.5% |
| Lean Republican | 10.4% | 82.1% |
| Strong Republican | 1.4% | 91.8% |
- By a margin of 31.7% right track to 52.8% wrong track, Michigan voters believe the state is on the wrong track.
| Survey | Right | Wrong |
| January 2020 | 44.5% | 26.2% |
| October 2020 | 44.9% | 41.3% |
| February 2021 | 46.6% | 38.9% |
| May 2021 | 40.4% | 45.2% |
| September 2021 | 38.7% | 47.2% |
| December 2021 | 31.7% | 52.8% |
###